Associate Professor (tenured)
Dept. of Biostatistics and Data Science, The University of Kansas Medical Center, KUMC, Kansas City
Member: The University of Kansas Cancer Center.

I studied Statistics at the Dept. of Statistics and Insurance Science (University of Piraeus, Greece) as an undergraduate. I obtained my M.Sc. diploma in Statistics and Data Analysis (University of the Aegean, Division of Statistics and Data Analysis, School of Sciences, Greece). My thesis dealt with issues of diagnostic testing and particularly with the properties of ROC surfaces. In 2007 I started my research as a Ph.D. candidate in Statistics (University of the Aegean). I focused on developing statistical approaches for the evaluation of diagnostic biomarkers in cases where censoring is present. For the 4-year period 2014-2018 I was a post-doctoral fellow researcher at the department of Biostatistics, MD Anderson Cancer Center (MDACC, The University of Texas, Houston, U.S.A). During my post doc I focused on methodology development and clinical collaborations related to lung, pancreatic, and prostate cancer within the MDACC. I am currently an Associate Professor at the dept. of Biostatistics, University of Kansas Medical Center (Kansas City, U.S.A.)
My primary research focus lies on the development of statistical methods related to (bio)marker evaluation. These involve ROC curves,-surfaces and hypersurfaces, kernel theory, GLMs, splines, accommodation of censored data, imputation techniques, issues of limits of detection, survival analysis, use of power transformations on biomarker data as well as other techniques that serve towards the evaluation and discovery of new markers.
Apart from statistical methodology, I have been collaborating closely with the departments of Clinical Cancer Prevention and Translational Molecular Pathology at the University of Texas MD Anderson Cancer Center (MDACC) as the lead statistician in multiple biomarker projects that involved multi-center studies. During these collaborations, I worked closely with the International Agency for Research of Cancer (World Health Organization, Lyon-France) on biomarker validation issues. My corresponding work dealt mainly with blood based biomarker discovery issues that involved combinations, modeling, and evaluation of proteins/ autoantibodies/ metabolites for the early detection of lung and pancreatic cancer. These collaborations led to the development of new non-invasive blood tests, that are also blindly validated on independent European populations. In collaboration with the Departments of Radiation Oncology and Surgical Oncology of the MDACC, I have also been engaging in evaluating quantified imaging markers and building panels for the detection of pancreatic cysts and pancreatic cancer. Some international (non-cancer related) collaborations of mine involve the Institute of Evolution at the University of Haifa, Israel (entomology), New Zealand's Brain Research Institute, Dept. of Psychology of the University of Canterbury (methods on Alzheimer study) and Dept. of Medicine of the University of Otago, New Zealand (methods on Alzheimer study), Dept. of Mathematics-University of the Aegean, Greece (methodology development), Dept. of Statistics-University of Haifa, Israel (methodology development), University of Thessaly-Laboratory of Biometry (methodology development). .
Two highlights of my clinical collaborations are the following:I am currently an Associate Editor for the Journal "Research Methods in Medicine and Health Sciences". Since 2014 I have also been serving repeatedly as a referee for various international scientific journals. These include:
My service includes participating in review panels of NASA that deal with projects related to the health effects of long duration space missions on astronauts, ultimately aiming for missions to Mars. Such projects include, but are not limited to, issues of long exposure to lack of gravity, stress, motor skill functions, maintenance of cognitive skills, brain activity and biomarkers etc.
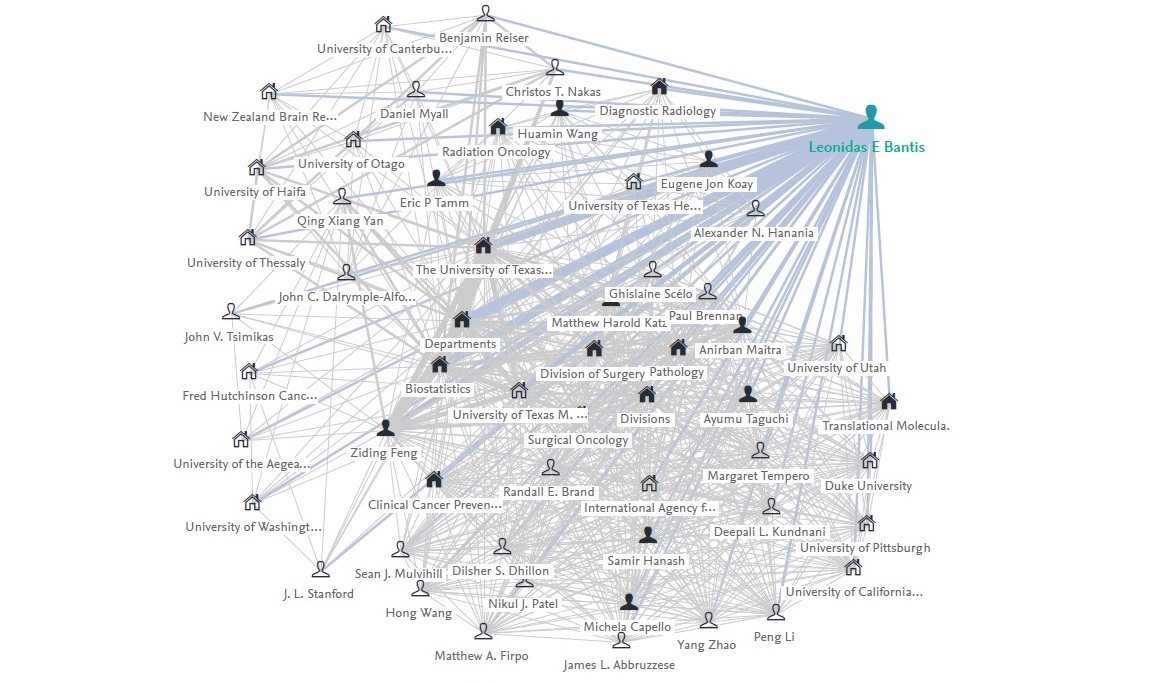
For the period 2007-2013 I have been involved in teaching (as an assistant) a variety of courses at the University of the Aegean (see relevant tab). I also serve as a member of the protocol review monitoring committee of the University of Kansas Cancer Center. I am a member of the Greek Statistical Institute, the International Society for Clinical Biostatistics, the International Biometric Society of both the Eastern Mediterranean Region and the Eastern Northern American Region. For some of my recent publications as well as for software (not only limited) to my methods click on the relevant tabs. For the most up-to-date list of all my publications, which also includes metrics w.r.t. the references to my work click here. Scroll down for a snapshot of my network.Dept. of Biostatistics and Data Science, The University of Kansas Medical Center, KUMC, Kansas City
Member: The University of Kansas Cancer Center.
Dept. of Biostatistics and Data Science, The University of Kansas Medical Center, KUMC, Kansas City
Supervisor: Prof. Ziding Feng.
Dept. of Biostatistics, MD Anderson Cancer Center, University of Texas (Houston)
Supervisor: Prof. Ziding Feng.
Hellenic Army
Artillery
Ph.D. in Statistics
Title: "Statistical methods for the evaluation of diagnostic biomarkers in the presence of censoring".
Supervisor: Dr. John V. Tsimikas.
University of the Aegean, Dept. of Statistics and Actuarial-Financial Mathematics, Division of Statistics and Data Analysis.
Master in Statistics and Data Analysis
Thesis title: "Properties of the ROC surfaces".
Supervisor: Dr. Christos T. Nakas
University of the Aegean, Dept. of Statistics and Actuarial-Financial Mathematics, Division of Statistics and Data Analysis.
Statistics and Insurance Science
University of Piraeus
Lorem ipsum dolor sit amet, consectetur adipisicing elit, sed do eiusmod tempor incididunt ut labore et dolore magna aliqua. Ut enim ad minim veniam, quis nostrud exercitation ullamco laboris nisi ut aliquip ex ea commodo consequat. Duis aute irure dolor in reprehenderit in voluptate velit esse cillum dolore eu fugiat nulla pariatur. Excepteur sint occaecat cupidatat non proident, sunt in culpa qui officia deserunt mollit anim id est laborum.
Lorem ipsum dolor sit amet, consectetur adipisicing elit, sed do eiusmod tempor incididunt ut labore et dolore magna aliqua. Ut enim ad minim veniam, quis nostrud exercitation ullamco laboris nisi ut aliquip ex ea commodo consequat. Duis aute irure dolor in reprehenderit in voluptate velit esse cillum dolore eu fugiat nulla pariatur. Excepteur sint occaecat cupidatat non proident, sunt in culpa qui officia deserunt mollit anim id est laborum.
Lorem ipsum dolor sit amet, consectetur adipisicing elit, sed do eiusmod tempor incididunt ut labore et dolore magna aliqua. Ut enim ad minim veniam, quis nostrud exercitation ullamco laboris nisi ut aliquip ex ea commodo consequat. Duis aute irure dolor in reprehenderit in voluptate velit esse cillum dolore eu fugiat nulla pariatur. Excepteur sint occaecat cupidatat non proident, sunt in culpa qui officia deserunt mollit anim id est laborum.
We provide new methods for the comparison of two survival curves, alternative to the log-rank and/or the MaxCombo test. Any use of this software implies reference to the corresponding paper. Click here to download.
We provide new methods that reveal how well can two biomarkers complement each other so that they can be considered in a biomarker panel. Any use of this software implies reference to the corresponding paper. Click here to download.
We provide a tutorial for inferences related to Box-Cox-based ROC curves and provide a new R package named 'rocbc' that can be found on CRAN. Any use of this software implies reference to the corresponding paper. Here we provide some more detailed simulation results and the COVID19 data used in our application section. Click here to download.
We provide new methods related to cutoff estimation for ternary tree and umbrella stochastic ordering settings. Any use of this software implies reference to the corresponding paper. Click here to download.
We provide new methods related to pVUS estimation and inference (provides hypothesis testing and confidence intervals) in 3-class settings. Any use of this software implies reference to the corresponding paper. Click here to download.
We provide new methods related to inferences around the optimal true class fraction triplet. Any use of this software implies reference to the corresponding paper. Click here to download.
We provide new methods related to inferences around the true and false class rates in trichotomous settings. Any use of this software implies reference to the corresponding paper. Click here to download.
We provide new methods related to cutoff estimation for continuous biomrkarkers in 3-class settings that are alternative to the Youden-based ones. Any use of this software implies reference to the corresponding paper. Click here to download.
We provide new methods related to improper ROCs. Any use of this software implies reference to the corresponding paper. Click here to download.
We provide new methods for estimating a survival function. Any use of this software implies reference to the corresponding paper. Click here to download.
We provide new methods for estimating a survival function. Any use of this software implies reference to the corresponding paper. Click here to download.
We provide new methods for estimating an ROC curve that corresponds to a biomarker that is subject to a lower and/or an upper limit of detection. We explore parametric, spline based, and kernel hybrid approaches based on multiple imputation. Any use of this software implies reference to the aforementioned paper. Click here to download.
We provide new methods for constructing confidence intervals for both the Youden index and its corresponding cutoff point. We explore approaches based on the delta approximation under the normality assumption, as well as power transformations to normality and nonparametric kernel and spline based approaches. Any use of this software implies reference to the aforementioned paper. Click here to download.
Any use of this software implies reference to the corresponding paper. Click here to download.
This works for both 32bit and 64bit machines. Please try to also run the demo included in the MATLAB R-link package, and make sure that everything works before trying this code. After that, you must download and install the packages "survival" and "matlab" in R. The analysis provided by this code is in fact the output as provided by the corresponding survival package (survfit) provided by prof. Terry Therneau. Click here for download and description.
The following distributions are supported:1. Normal (normfitc) 2. Log-Normal (lognfitc) 3. Logistic (logistfitc) 4. Log-logistic (loglogistfitc) 5. Extreme value (evfitc) 6. Weibull (wblfitc) 7. Exponential (expfitc) 8. Gamma (gamfitc) 9. Rayleigh (raylfitc). Click here for download and description.
The “aft” function fits models of the form: Y=log(T)=g0+g1*Z1+g2*Z2+...+sigma*epsilon where usually T is a time to event variable and g0, g1, ... and sigma are to be estimated. Since T is a time to event variable censoring might be involved. The “aft” function deals with possibly right and/or left censored data. With "sigma" we denote the scale parameter, and the regression coefficients are denoted by vector g=[g0 g1 g2...]. The covariates are denoted with Z1, Z2, ... The distribution of "epsilon" defines the distribution of T. The user can specify this distribution using one of the following available options: Exponential, Weibull, Log-normal, Log-logistic, Generalized Gamma. The “aft” routine is supposed to be a MATLAB alternative to proc lifereg of SAS, or survreg of R. However the “aft” has less options. Click here for download and description.
Background: CA19-9, which is currently in clinical use as a pancreatic ductal adenocarcinoma (PDAC) biomarker, has limited performance in detecting early-stage disease. We and others have identified protein biomarker candidates that have the potential to complement CA19-9. We have carried out sequential validations starting with 17 protein biomarker candidates to determine which markers and marker combination would improve detection of early-stage disease compared with CA19-9 alone. Methods: Candidate biomarkers were subjected to enzyme-linked immunosorbent assay based sequential validation using independent multiple sample cohorts consisting of PDAC cases (n = 187), benign pancreatic disease (n = 93), and healthy controls (n = 169). A biomarker panel for early-stage PDAC was developed based on a logistic regression model. All statistical tests for the results presented below were one-sided. Results: Six out of the 17 biomarker candidates and CA19-9 were validated in a sample set consisting of 75 PDAC patients, 27 healthy subjects, and 19 chronic pancreatitis patients. A second independent set of 73 early-stage PDAC patients, 60 healthy subjects, and 74 benign pancreatic disease patients (combined validation set) yielded a model that consisted of TIMP1, LRG1, and CA19-9. Additional blinded testing of the model was done using an independent set of plasma samples from 39 resectable PDAC patients and 82 matched healthy subjects (test set). The model yielded areas under the curve (AUCs) of 0.949 (95% confidence interval [CI] = 0.917 to 0.981) and 0.887 (95% CI = 0.817 to 0.957) with sensitivities of 0.849 and 0.667 at 95% specificity in discriminating early-stage PDAC vs healthy subjects in the combined validation and test sets, respectively. The performance of the biomarker panel was statistically significantly improved compared with CA19-9 alone (P smaller than .001, combined validation set; P smaller than .008, test set). Conclusion: The addition of TIMP1 and LRG1 immunoassays to CA19-9 statistically significantly improves the detection of early-stage PDAC.
Objective: To investigate using quantitative imaging to assess the malignant potential of intraductal papillary mucinous neoplasms (IPMNs) in the pancreas. Background: Pancreatic cysts are identified in over 2% of the population and a subset of these, including intraductal papillary mucinous neoplasms (IPMNs), represent pre-malignant lesions. Unfortunately, clinicians cannot accurately predict which of these lesions are likely to progress to pancreatic ductal adenocarcinoma (PDAC). Methods: We investigated 360 imaging features within the domains of intensity, texture and shape using pancreatic protocol CT images in 53 patients diagnosed with IPMN (34 “high-grade” [HG] and 19 “low-grade” [LG]) who subsequently underwent surgical resection. We evaluated the performance of these features as well as the Fukuoka criteria for pancreatic cyst resection. Results: In our cohort, the Fukuoka criteria had a false positive rate of 36%. We identified 14 imaging biomarkers within Gray-Level Co-Occurrence Matrix (GLCM) that predicted histopathological grade within cyst contours. The most predictive marker differentiated LG and HG lesions with an area under the curve (AUC) of .82 at a sensitivity of 85% and specificity of 68%. Using a cross-validated design, the best logistic regression yielded an AUC of 0.96 (σ = .05) at a sensitivity of 97% and specificity of 88%. Based on the principal component analysis, HG IPMNs demonstrated a pattern of separation from LG IPMNs. Conclusions: HG IPMNs appear to have distinct imaging properties. Further validation of these findings may address a major clinical need in this population by identifying those most likely to benefit from surgical resection
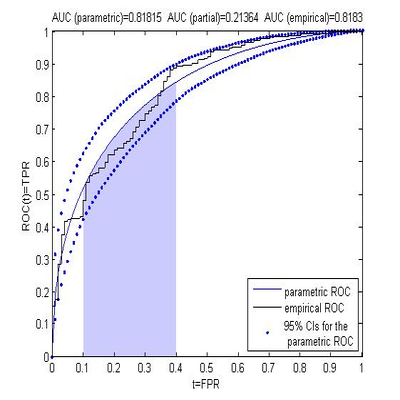
The receiver operating characteristic (ROC) curve is the most popular statistical tool for evaluating the discriminatory capability of a given continuous biomarker. The need to compare two correlated ROC curves arises when individuals are measured with two biomarkers, which induces paired and thus correlated measurements. Many researchers have focused on comparing two correlated ROC curves in terms of the area under the curve (AUC), which summarizes the overall performance of the marker. However, particular values of specificity may be of interest. We focus on comparing two correlated ROC curves at a given specificity level. We propose parametric approaches, transformations to normality, and nonparametric kernel-based approaches. Our methods can be straightforwardly extended for inference in terms of the inverse ROC(t). This is of particular interest for comparing the accuracy of two correlated biomarkers at a given sensitivity level. Extensions also involve inference for the AUC and accommodating covariates. We evaluate the robustness of our techniques through simulations, compare them with other known approaches, and present a real-data application involving prostate cancer screening.
The three-class approach is used for progressive disorders when clinicians and researchers want to diagnose or classify subjects as members of one of three ordered categories based on a continuous diagnostic marker. The decision thresholds or optimal cut-off points required for this classification are often chosen to maximize the generalized Youden index (Nakas et al., Stat Med 2013; 32: 995–1003). The effectiveness of these chosen cut-off points can be evaluated by estimating their corresponding true class fractions and their associated confidence regions. Recently, in the two-class case, parametric and non-parametric methods were investigated for the construction of confidence regions for the pair of the Youden-index-based optimal sensitivity and specificity fractions that can take into account the correlation introduced between sensitivity and specificity when the optimal cut-off point is estimated from the data (Bantis et al., Biomet 2014; 70: 212–223). A parametric approach based on the Box–Cox transformation to normality often works well while for markers having more complex distributions a non-parametric procedure using logspline density estimation can be used instead. The true class fractions that correspond to the optimal cut-off points estimated by the generalized Youden index are correlated similarly to the two-class case. In this article, we generalize these methods to the three- and to the general k-class case which involves the classification of subjects into three or more ordered categories, where ROC surface or ROC manifold methodology, respectively, is typically employed for the evaluation of the discriminatory capacity of a diagnostic marker. We obtain three- and multi-dimensional joint confidence regions for the optimal true class fractions. We illustrate this with an application to the Trail Making Test Part A that has been used to characterize cognitive impairment in patients with Parkinson’s disease.
After establishing the utility of a continuous diagnostic marker investigators will typically address the question of determining a cut-off point which will be used for diagnostic purposes in clinical decision making. The most commonly used optimality criterion for cut-off point selection in the context of ROC curve analysis is the maximum of the Youden index. The pair of sensitivity and specificity proportions that correspond to the Youden index-based cut-off point characterize the performance of the diagnostic marker. Confidence intervals for sensitivity and specificity are routinely estimated based on the assumption that sensitivity and specificity are independent binomial proportions as they arise from the independent populations of diseased and healthy subjects, respectively. The Youden index-based cut-off point is estimated from the data and as such the resulting sensitivity and specificity proportions are in fact correlated. This correlation needs to be taken into account in order to calculate confidence intervals that result in the anticipated coverage. In this article we study parametric and non-parametric approaches for the construction of confidence intervals for the pair of sensitivity and specificity proportions that correspond to the Youden index-based optimal cut-off point. These approaches result in the anticipated coverage under different scenarios for the distributions of the healthy and diseased subjects. We find that a parametric approach based on a Box–Cox transformation to normality often works well. For biomarkers following more complex distributions a non-parametric procedure using logspline density estimation can be used.
N/A
N/A
N/A
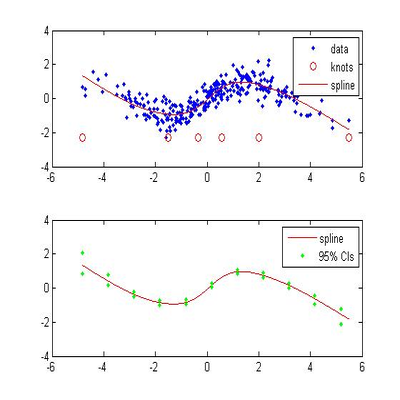
The use of ROC curves in evaluating a continuous or ordinal biomarker for the discrimination of two populations is commonplace. However, in many settings, marker measurements above or below a certain value cannot be obtained. In this paper, we study the construction of a smooth ROC curve (or surface in the case of three populations) when there is a lower or upper limit of detection. We propose the use of spline models that incorporate monotonicity constraints for the cumulative hazard function of the marker distribution. The proposed technique is computationally stable and simulation results showed a satisfactory performance. Other observed covariates can be also accommodated by this spline-based approach.
N/A
N/A
N/A
N/A
N/A
N/A
N/A
N/A
The problem of estimating the parameters in a generalized linear model when a covariate is subject to censoring is studied. A new method based on an estimating function approach is proposed. The method does not assume a parametric form for the distribution of the response given the regressors and is computationally simple. In the linear regression case, the proposed approach implies the use of mean imputation of the censored regressor. The use of flexible parametric models for the distribution of the covariate is employed. When survival time is considered as the covariate subject to censoring, the use of the generalized gamma distribution is explored, since it is considered as a platform distribution covering a wide variety of hazard rate shapes. The method can be further robustified by considering models of nonparametric nature typically used in survival analysis such as the logspline for the censored covariate. For models involving additional, fully observed, covariates the use of a generalized gamma accelerated failure time regression model is explored. In this setting, no parametric family assumption for the extra covariates is needed. The proposed approach is broader than likelihood based multiple imputation techniques. Moreover, even in cases with a known parametric form for the response distribution, the method can be considered a feasible alternative to likelihood based estimation. Simulation studies are conducted for continuous, binary and count data to evaluate the performance of the proposed method and to compare the estimates to standard ones. An application using a well known data set of a randomized placebo controlled trial of the drug D-penicillamine (DPCA) for the treatment of primary biliary cirrhosis (PBC) conducted at the Mayo Clinic is presented. Possible extensions of the method regarding the robustness as well as the type of censoring are also discussed.
In this paper we explore the estimation of survival probabilities via a smoothed version of the survival function, in the presence of censoring. We investigate the fit of a natural cubic spline on the cumulative hazard function under appropriate constraints. Under the proposed technique the problem reduces to a restricted least squares one, leading to convex optimization. The approach taken in this paper is evaluated and compared via simulations to other known methods such as the Kaplan Meier and the logspline estimator. Our approach is easily extended to address estimation of survival probabilities in the presence of covariates when the proportional hazards model assumption holds. In this case the method is compared to a restricted cubic spline approach that involves maximum likelihood. The proposed approach can be also adjusted to accommodate left censoring.
We tested the hypothesis whether developmental acclimation at ecologically relevant humidity regimes (40% and 75% RH) affects desiccation resistance of pre-adults (3rd instar larvae) and adults of Drosophila melanogaster Meigen (Diptera: Drosophilidae). Additionally, we untangled whether drought (40% RH) acclimation affects cold-tolerance in the adults of D. melanogaster. We observed that low humidity (40% RH) acclimated individuals survived significantly longer (1.6-fold) under lethal levels of desiccation stress (0–5% RH) than their counter-replicates acclimated at 75% RH. In contrast to a faster duration of development of 1st and 2nd instar larvae, 3rd instar larvae showed a delayed development at 40% RH as compared to their counterparts grown at 75% RH. Rearing to low humidity conferred an increase in bulk water, hemolymph content and dehydration tolerance, consistent with increase in desiccation resistance for replicates grown at 40% as compared to their counterparts at 75% RH. Further, we found a trade-off between the levels of carbohydrates and body lipid reserves at 40% and 75% RH. Higher levels of carbohydrates sustained longer survival under desiccation stress for individuals developed at 40% RH than their congeners at 75% RH. However, the rate of carbohydrate utilization did not differ between the individuals reared at these contrasting humidity regimes. Interestingly, our results of accelerated failure time (AFT) models showed substantial decreased death rates at a series of low temperatures (0, − 2, or − 4 °C) for replicates acclimated at 40% RH as compared to their counter-parts at 75% RH. Therefore, our findings indicate that development to low humidity conditions constrained on multiple physiological mechanisms of water-balance, and conferred cross-tolerance towards desiccation and cold stress in D. melanogaster. Finally, we suggest that the ability of generalist Drosophila species to tolerate fluctuations in humidity might aid in their existence and abundance under expected changes in moisture level in course of global climate change.
I was involved in teaching various subjects as an assistant at both undergraduate and postgraduate level students at the Dept. of Statistics and Actuarial-Financial Mathematics, University of the Aegean.
Ph.D. program of KUMC Click here to download lecture 1. Click here to download lecture 2. Click here to download lecture 3. Click here to download lecture 4. Click here to download lecture 5. Click here to download lecture 6. Click here to download lecture 7. Click here to download lecture 8 Click here to download lecture 9 Click here to download lecture 10 Click here to download lecture 11 Click here to download lecture 12.
(MSc) with Dr. John V. Tsimikas
(MSc) with Dr. John V. Tsimikas
(MSc) with Dr. John V. Tsimikas
(BSc) with Dr. John V. Tsimikas
(MSc) with Dr. John V. Tsimikas
(MSc) with Dr. Stelios Zimeras
(BSc) with Dr. Petros E. Maravelakis
(BSc) with Dr. Stelios Zimeras